China Aluminum Smelting Industry Monthly Prosperity Index Report, March 2025 (China Nonferrous Metals Industry Association)
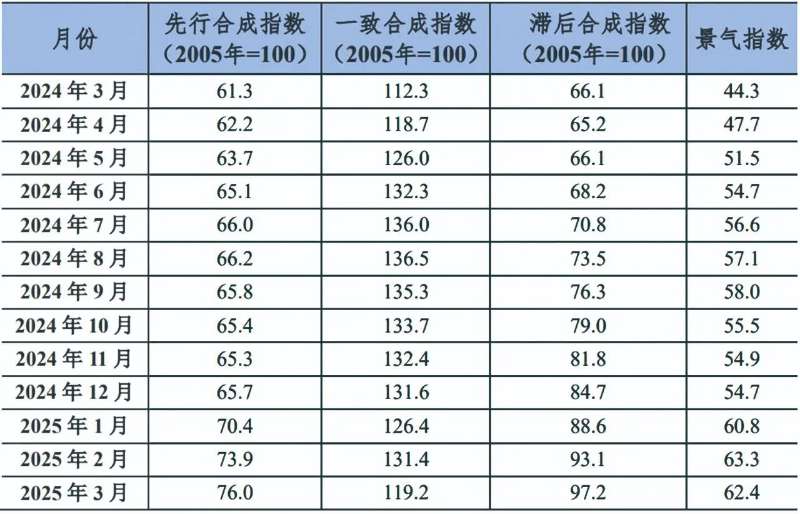
In March, the China Aluminum Smelting Industry Prosperity Index was 62.4, a decrease of 0.9 points from February, remaining in the upper part of the "normal" range; the leading composite index was 76, an increase of 2.1 points from February. The China Aluminum Smelting Industry Prosperity Index for the past 13 months is shown in the table below.
China Aluminum Smelting Industry Prosperity Index for the Past 13 Months
The prosperity index remained stable, slightly lower than in February.
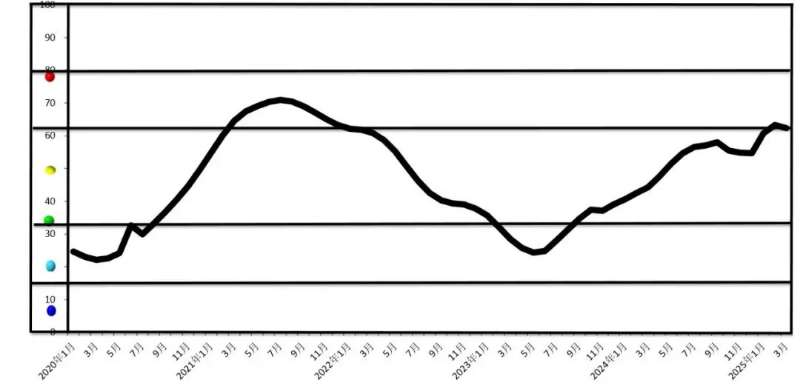
In March, the China aluminum smelting industry continued its good development trend, with the overall prosperity index remaining stable at a high level. In March, the aluminum smelting industry prosperity index was 62.4, a decrease of 0.9 points from February, indicating stable industry operation, with both market demand and supply remaining within a stable range. The trend of the China Aluminum Smelting Industry Monthly Prosperity Index is shown in Figure 1.
Figure 1: Trend Chart of China's Aluminum Smelting Industry Prosperity Index
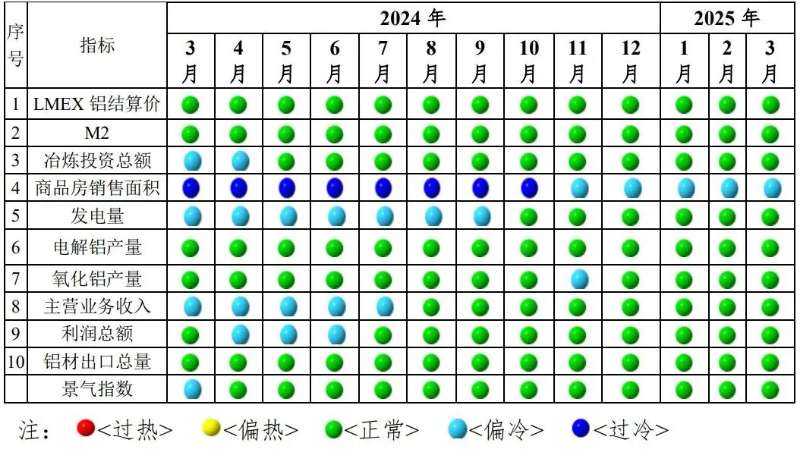
As shown in Figure 2, among the 10 indicators constituting the China Aluminum Smelting Industry Prosperity Signal, in March, 9 were in the "normal" range, with only "sales area of commercial housing" in the "slightly cold" range.
Figure 2: China's Aluminum Smelting Industry Prosperity Signal
The Leading Composite Index Increased Slightly Compared to February
In March, the leading composite index was 76, an increase of 2.1 points compared to February. While there have been some fluctuations in the industry recently, the overall economic trend of the aluminum smelting industry is positive. It is expected that the growth rate of China's aluminum smelting industry may slow down in the near future, but an optimistic outlook remains. Fluctuations in the leading index are mainly affected by multiple factors, including market demand expectations, raw material price changes, and industry policy guidance.
Specific Indicator Analysis
Firstly, the upward trend in aluminum prices continued. In March, the LME aluminum price index was 109.9, an increase of 1.6 points, indicating that international aluminum prices continued their upward trend. The rise in aluminum prices reflects strong market demand or tight supply, and the profit margins of aluminum smelting companies are expected to continue to improve.
Second, M2 (money supply) rose slightly. In March, the money supply index was 50.6, an increase of 7 points from February, remaining stable without significant fluctuations. A stable monetary environment provides favorable financing conditions for the aluminum smelting industry.
Third, the aluminum smelting investment index rose sharply. In March, the aluminum smelting investment index was 157.7, a significant increase from February. This sharp rise in the investment index is partly due to companies' positive outlook on the industry's future development, leading to increased investment in infrastructure construction, technological upgrades, and capacity expansion, indicating that the industry's future production capacity and technological level are expected to further improve.
Fourth, the real estate market continued its recovery trend, but remained relatively weak overall. In March, the commercial housing sales area index was -17.8, an increase of 3.6 points from February. The real estate industry is an important downstream application area for aluminum, and its gradual improvement will have a positive impact on aluminum demand.
Fifth, the electricity generation index declined slightly. In March, the power generation index was 10.8, a decrease of 2.3 points from February, indicating a slight slowdown in industrial production activity, which may have some impact on the energy supply and production costs of aluminum smelting enterprises. The aluminum smelting industry is a high-energy-consuming industry, and the stability and cost of power supply are crucial to the production and operation of enterprises. The impact of subsequent power supply conditions on the industry needs to be monitored.
Sixth, the electrolytic aluminum production index rose, and the alumina production index continued to grow. In March, the electrolytic aluminum production index was 21.5, a significant increase from February, reflecting that electrolytic aluminum producers moderately increased production driven by market demand and price factors. The alumina production index was 57.4, an increase of 8.5 points from February, continuing its upward trend. Recent increases in alumina prices have prompted factories to increase their operating rates, ensuring the supply of raw materials for electrolytic aluminum production.
Seventh, industry profitability maintained a growth trend. In March, the main business revenue and profit indices for the aluminum smelting industry were 79 and 165.8 respectively, maintaining a high level overall, demonstrating the strong profitability and market competitiveness of the aluminum smelting industry. Aluminum smelting enterprises have effectively responded to market changes and achieved steady profit growth by optimizing product structure, improving production efficiency, and strengthening cost control.
Eighth, the aluminum export index declined sharply. In March, the total aluminum export index fell to -36.9, a significant decrease compared to February. Recently, my country canceled export tax rebates for some products such as copper and aluminum. Affected by this, domestic aluminum processing enterprises' export intentions weakened, and aluminum exports declined significantly. Aluminum smelting enterprises need to actively explore the domestic market or seek other international market opportunities to alleviate export pressure.
In summary, under the premise that the national economy continues its stable development trend, it is expected that my country's aluminum smelting industry will continue to operate within the "normal" range in the near future, and the prosperity index may rise.
Notes:
1. The Leading Composite Index for the Aluminum Smelting Industry (hereinafter referred to as the "Leading Index") is used to judge the recent trend of economic changes in the aluminum smelting industry. This index consists of the following five indicators: LME aluminum settlement price, M2, total fixed asset investment in aluminum smelting projects, commercial housing sales area, and electricity generation.
2. The Consistent Composite Index for the Aluminum Smelting Industry (hereinafter referred to as the "Consensus Index") reflects the current economic operation of the aluminum smelting industry. This index consists of the following five indicators: electrolytic aluminum production, alumina production, operating revenue of aluminum smelting enterprises, total profit of aluminum smelting enterprises, and total aluminum product exports.
3. The Lagging Composite Index for the Aluminum Smelting Industry (hereinafter referred to as the "Lagging Index"), together with the Consistent Index, is mainly used to monitor economic trends and serves as a post-hoc verification tool. This index consists of the following three indicators: working capital balance of aluminum smelting enterprises, accounts receivable balance of aluminum smelting enterprises, and finished goods cash balance of aluminum smelting enterprises.
4. The Comprehensive Prosperity Index reflects the current prosperity level of the aluminum smelting industry. The prosperity indicator chart divides the economic operation status of the aluminum smelting industry into five levels: "red light" indicates an overheated economy, "yellow light" indicates a slightly overheated economy, "green light" indicates normal economic operation, "light blue light" indicates a slightly sluggish economy, and "blue light" indicates a severely sluggish economy. Different weights are assigned to individual indicator lights, and the resulting composite business climate index is also displayed in five light zones.
The composite business climate index consists of 10 indicators, namely the leading and coincident indices.
5. All indicators used in compiling the index have been seasonally adjusted to eliminate seasonal factors.
6. The monthly business climate index is revised monthly. When the latest month's data is added to the time series, the previous monthly business climate index will change to varying degrees; this is the result of automatic model correction.